October 2022
What’s New:
Chart View
Avnio Tables now support integrated chart view to visualise data easily and efficiently
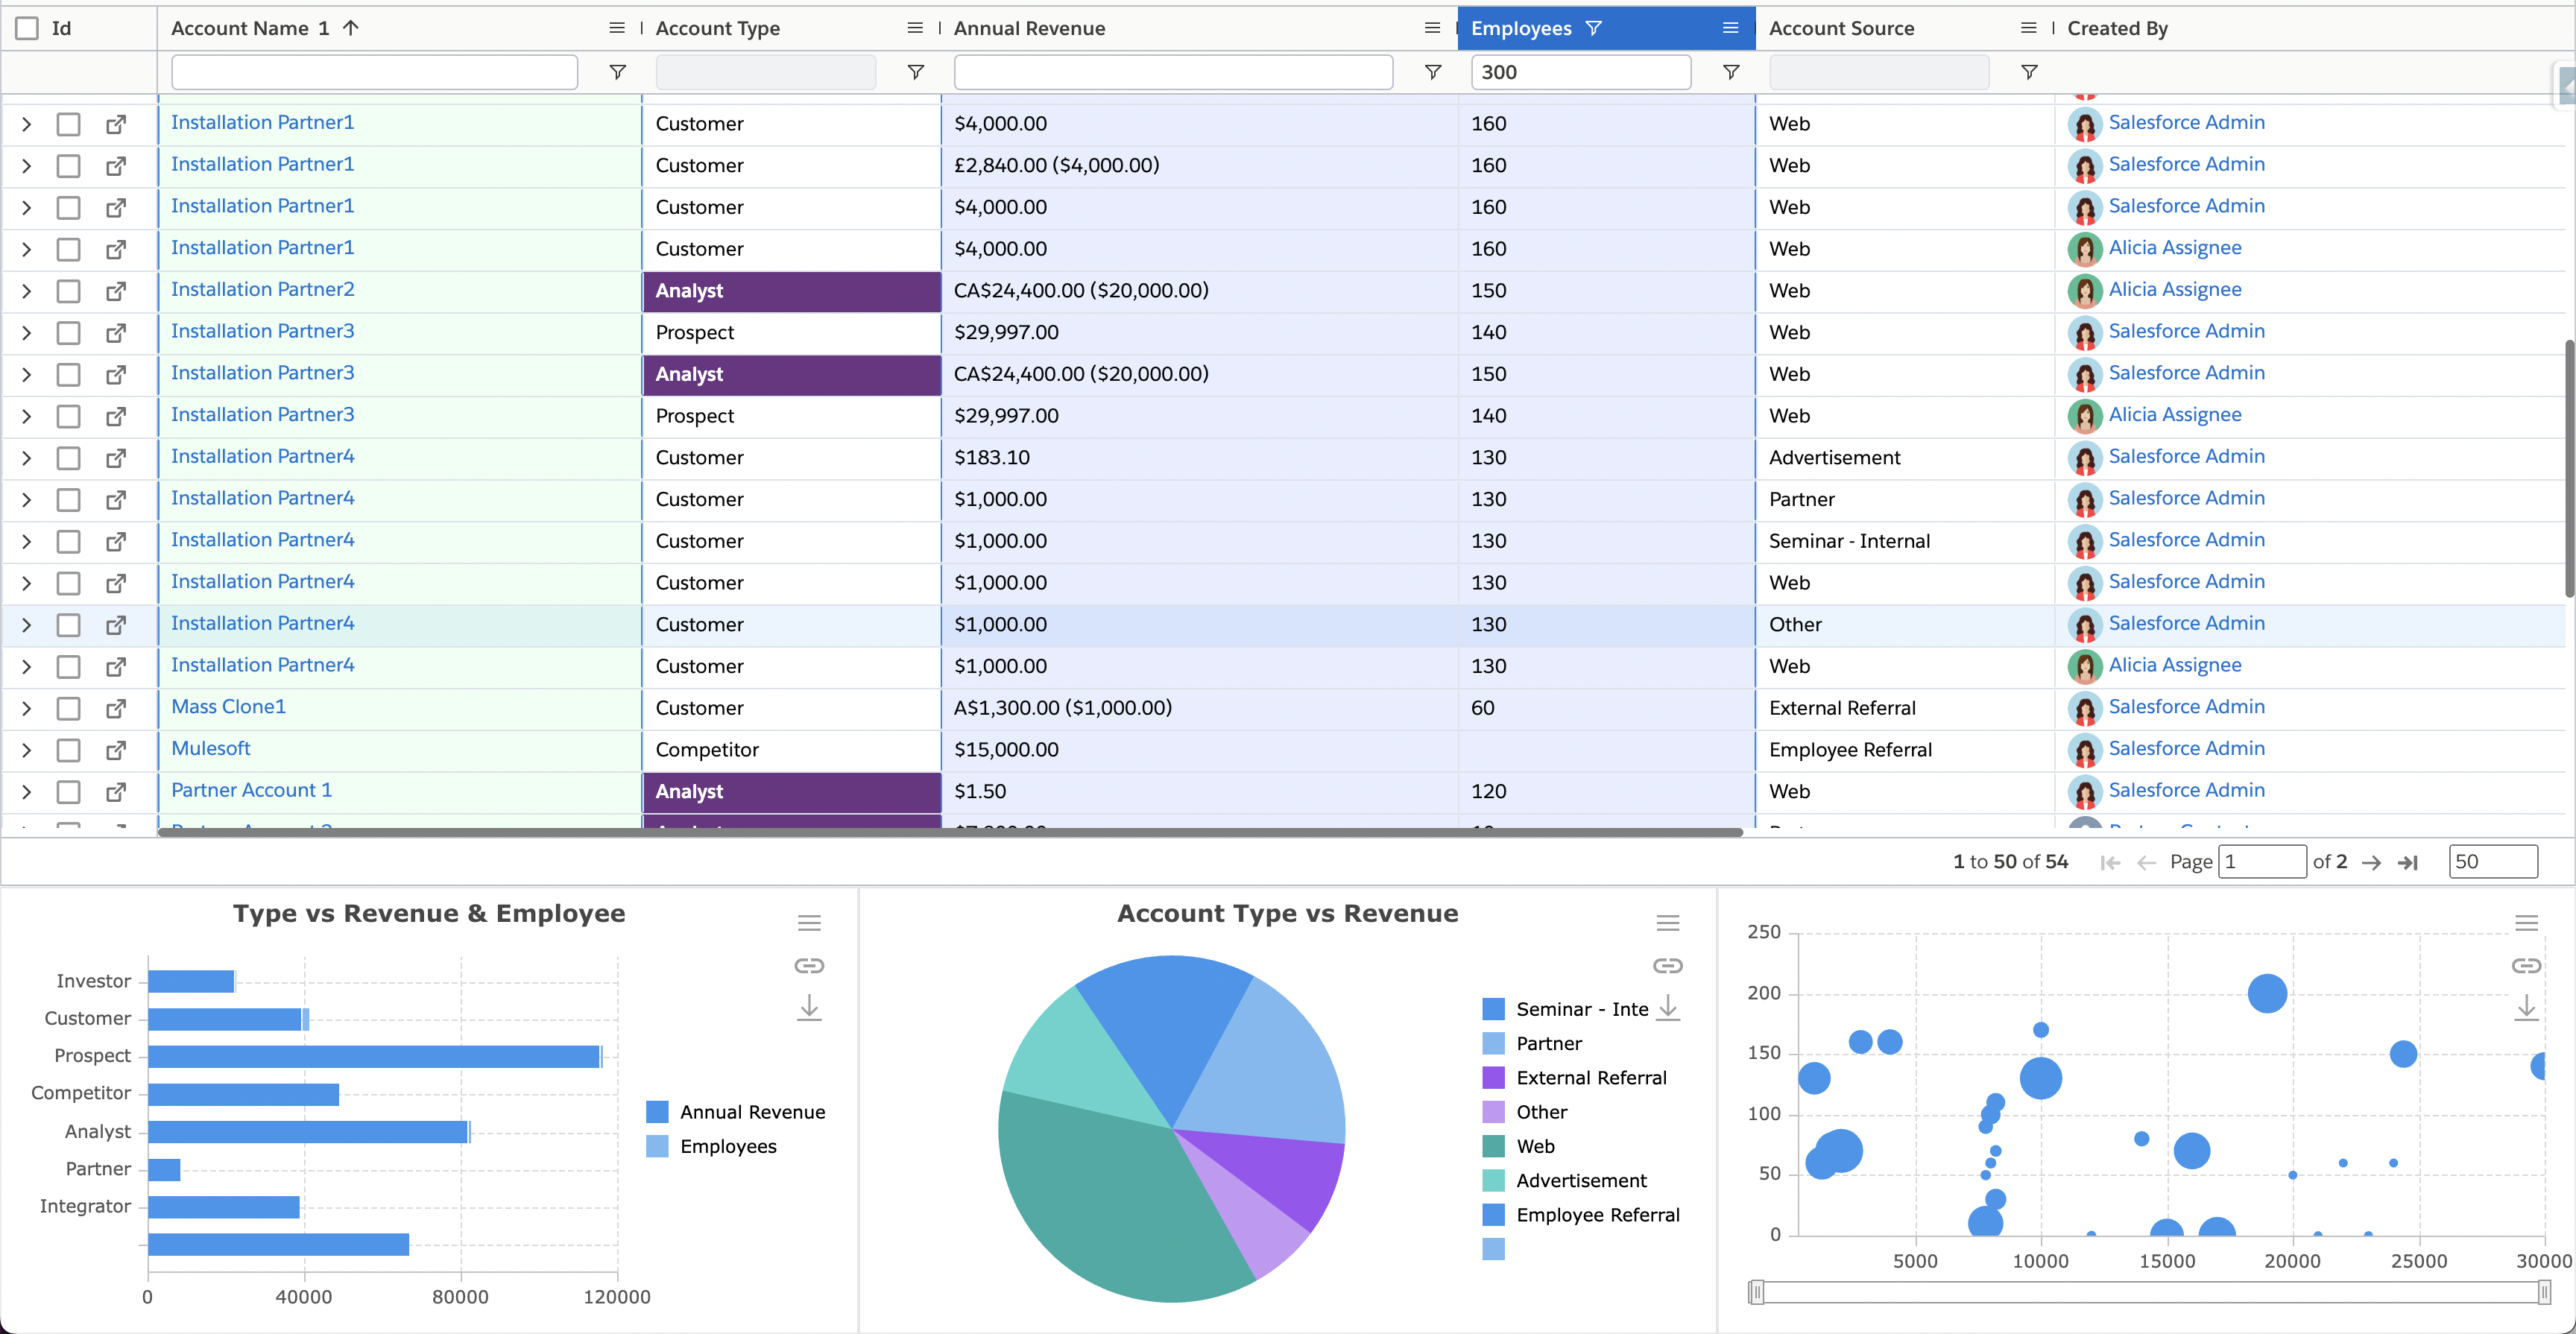
Tables View with Chart View
Ability to setup and display multiple charts for selected view with below options
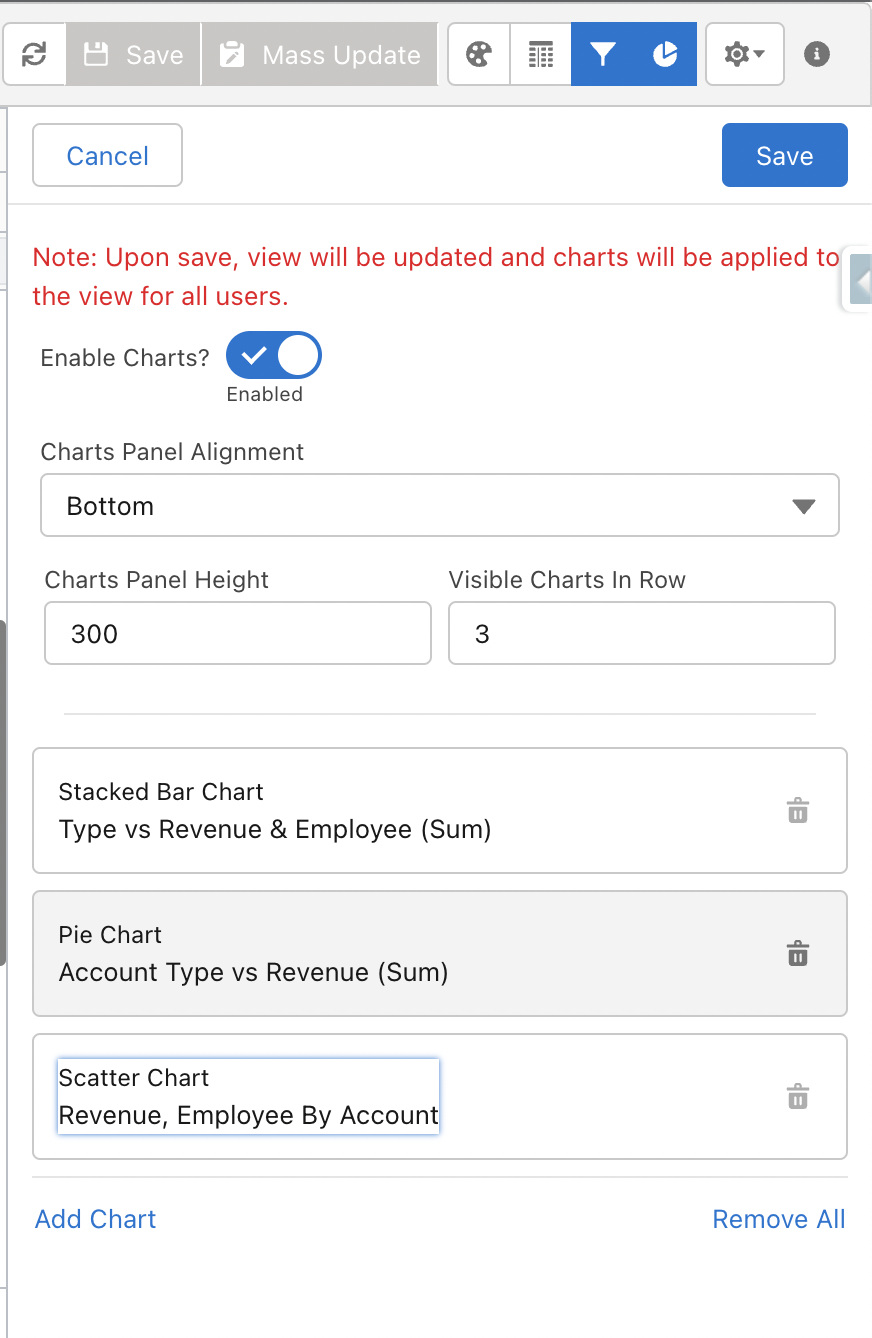
Enable Charts: Switch to turn chart(s) on / off.
Charts Panel Alignment: Indicate where to display chart compared to tables view. Options are Top, Bottom
Charts Panel Height: Specify Chart Panel height in pixels
Visible Charts in Row: Specify how many charts can be seen at time. For small device system will show only one chart due to space constraints. For larger screen this can be set any numbers. For example, if value is 3 and total 4 charts added then system will show 3 charts in current view while remaining chart can be seen after scrolling horizontally.
Add Chart: Click to add new chart
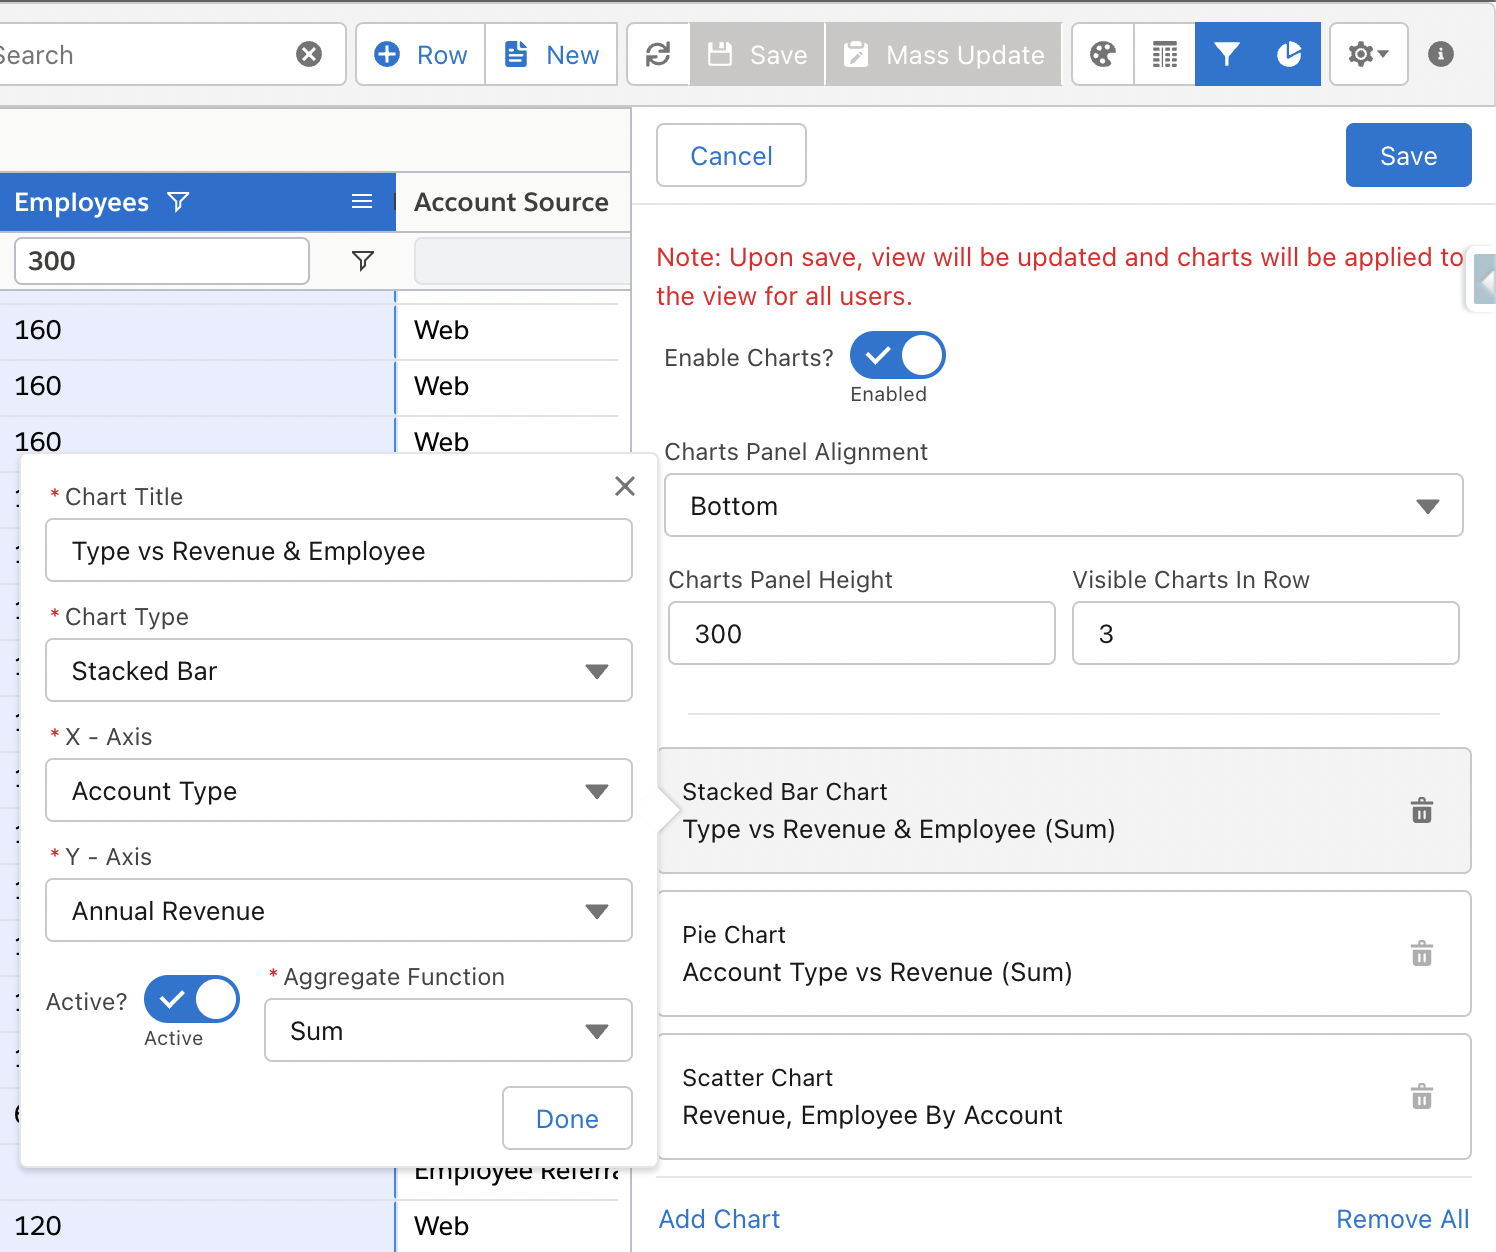
Chart Title: Title of the chart
Chart Type: Type of chart like Bar, Pie etc
X-Axis: Field to be displayed on x-axis
Y-Axis: Numeric field to be displayed on y-axis
Active: Switch to activate / deactivate chart
Aggregate Function: To aggregate y-axis value, options are sum, min, max etc.
Ability to download chart in
.pngimage format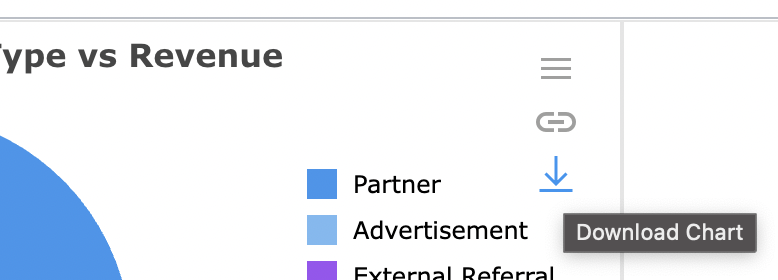
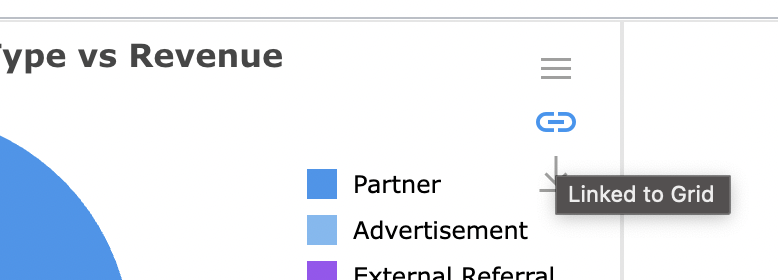
Charts are by default integrated with view changes (sorting, filtering), can be unlinked/linked from link icon in chart
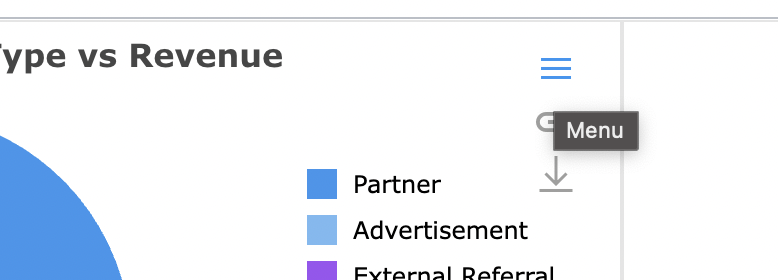
Charts can be added from chart icon and then can be customised further with themes & options from hamburger icon within chart UI

Charts will be saved along with “Save View” action or from charts panel opened from charts icon
Chart Limitations
X-Axis only support non numeric values like Text, Pick list, Lookup, Date etc whereas Y-Axis only supports numeric values.
With “Count“ aggregate functions, only use “#“ (Row number), do not use any other columns & with aggregate functions other than “Count“ do not use “#“(Row number) column.
Currently Stacked or Grouped charts do not supports multi-level grouping like Account Count By Owner & for Same Owner Count by Account Type. You can only aggregate multiple different columns like Sum of Account Revenue & Employees by Account Type.
Related Views (related list)
Visibility (private, public, public read-only) of related views will be synced with main/parent view
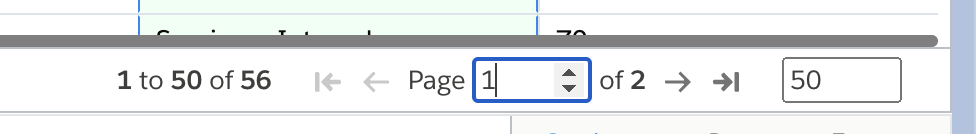
Pagination
Ability to navigate to specific page & set custom pagination size with input. This will help users to quickly switch & navigate to records without clicking next & previous page buttons multiple times
What’s Improved:
Views Drop-down
View switcher drop-down will now show alphabetically sorted views based on names
Bulk Data
Large set of data can now be loaded without issues with extended request timeout limit
Default record set chunk size is reduced to load more data quickly & concurrently
Validation rule messages, no rows message, view & related view update errors will be now shown better with specific message display instead of generic message
Filter & chart panels will be closed when changing view
Performance improvements for quicker loading & navigation
What’s Fixed:
Instant inline editing (key press on selected cell) will now work correctly with alphabet keys
Navigation to records and URLs will now correctly redirect when in community/experience sites
Column filters will now show correct record names for queue & public group owners instead of record IDs
Issue in advanced filters with non-text fields having blank values